
This is the first in a series of 3 analyses comparing development “Impact Fees” and Building Permit-related fees between 10 California cities from around the state where we’ve currently or recently had projects. The next 2 studies will use a new multi-family housing project, and a tenant improvement project as the prototype project.
Heilbronner AM will prepare an Agency Fee Schedule that is tailored specifically to your project regardless of location. Contact Us if you’re interested in obtaining an agency fee estimate for your project.
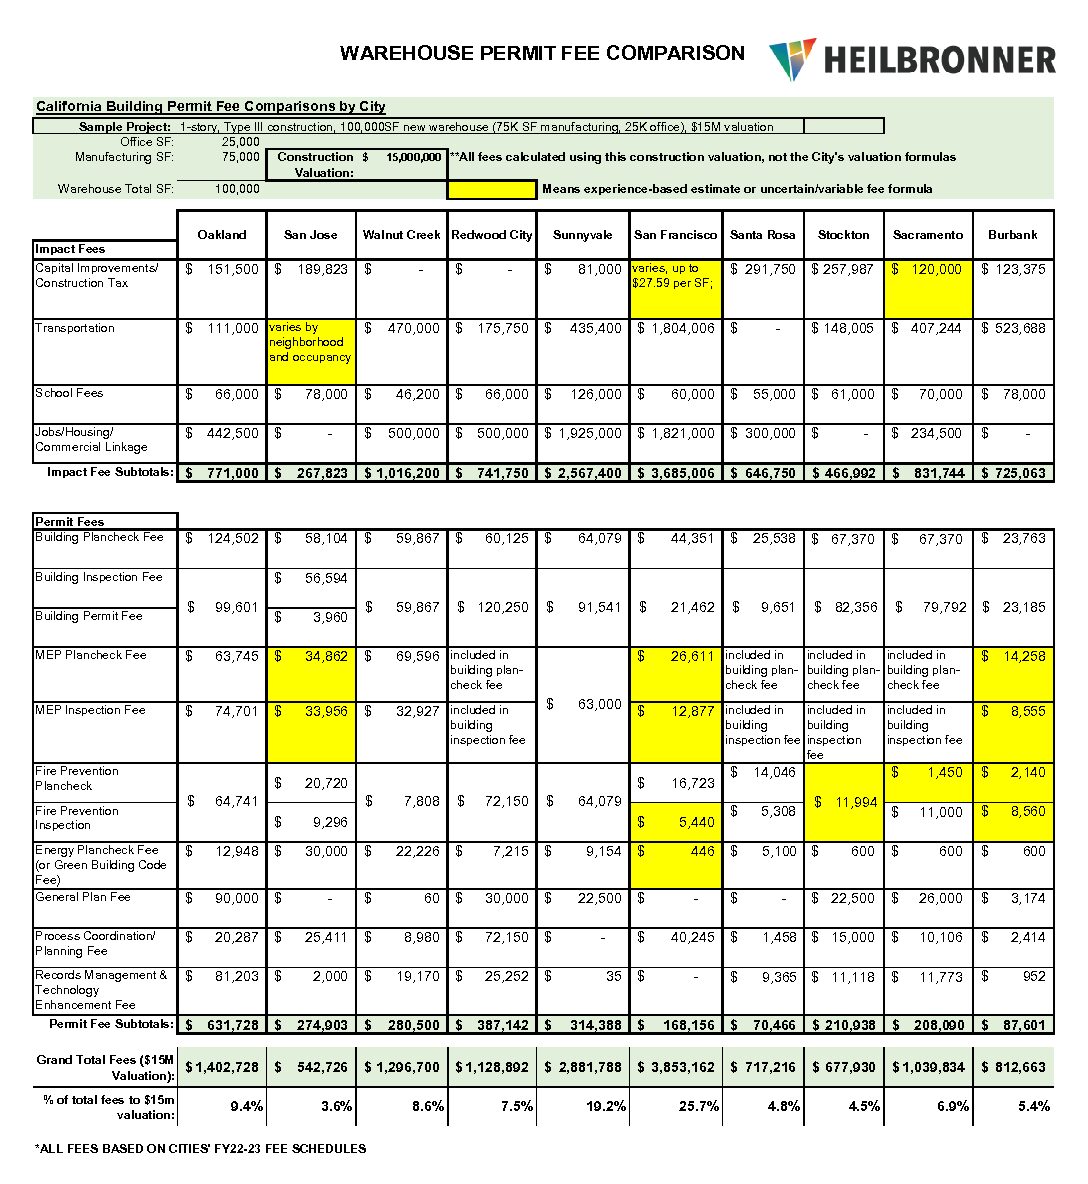
Method of the Comparison
The fee comparison uses a prototype project as a basis for its fee calculations, in this case a 1-story, Type III construction, 100,000 SF new warehouse (75K SF manufacturing, 25K SF office), with a $15M valuation, as described in the graphic below.
The specific fee categories chosen are based on the most common types of fees found consistently in cities across the state. The fees included are not a complete representation of the fees applied to a project in any given city, but we tried to include the most prominent fees in the ‘impact fee’ and ‘building permit-related’ fee categories. Fees relating to entitlements, other departments, utilities, or agencies may be addressed in future fee comparisons.
The fee comparison is not perfect, but it should be representative of how much individual fees can differ between municipalities for the same project, assuming the same valuation.
Construction Valuations are Not Uniform Across Jurisdictions
For the uninitiated, Impact Fees and Building Permit fees (and their relatives in other departments) are generally based on the project’s Construction Valuation and Occupiable Floor Area (excluding spaces like parking garages, and storage – in some cases), or a combination thereof. For a prototype project comparison like this, Floor Area is a constant regardless of jurisdiction, but the same is not the case when it comes to Construction Valuation.
It is not common for every city to use the same (or even similar) construction valuation formula, even if all other categorical inputs (occupancy, building type, floor area) are the same. Most cities use the International Code Council (ICC)’s Building Valuation Data table, which is updated bi-annually, as the basis for their own construction valuations. The ICC Table represents average construction values on a per-square foot basis, based on occupancy and construction types. The ICC then recommends that individual jurisdictions apply a “Regional Cost Modifier” to adjust the per-sq. ft. values to more accurately reflect local market conditions. Most jurisdictions do this, but some do not take that extra step and just use the ICC’s published values (and some others don’t use the ICC values at all). See the 2020 ICC Valuation Data for an example.
To illustrate, in the 2022-23 fiscal year, a new construction office building (B occupancy), with type IIIA construction, would be valued at $87.68 per SF in Santa Rosa, but at $194.91 per SF in San Jose. That’s a 222% difference in valuation for the same project just 80 miles apart from each other, which is massive. And while this does not necessarily have a pro-rata impact on impact and permit fees (every city’s fee formulas differ), those types of differences generally have pretty strong correlation to the fee totals as well.
Therefore, while we used $15M constant valuation for the comparative study, if you use each city’s individual valuation formulas, the construction valuation ranged between just under $6M to over $20M based on the same prototype warehouse project described above. For the fees used in this study, that translates to between $164K less in fees, up to $28,464 more in fees (depending on jurisdiction) when compared to the fees generated by a $15M valuation.
This all goes to show that a contractor’s construction estimate may vary dramatically from the estimate any given city will use for the purpose of calculating impact and permit fees.
Additional Notes regarding the Fee Study
All estimates are based on the best information available at the time, and in some instances, past experience.
Many cities, especially larger cities, also have other significant fees that apply to specific/area plans or other geographically defined ‘assessment districts.’ In cities where these regional fees are not applied to all property within city boundaries, or have high variance between neighborhoods, the fees were excluded as they would not fairly represent the cities for comparative purposes.
This comparison is based on FY22-23 fee schedules obtained from the represented cities. Per our previous post – fees can fluctuate significantly from year to year, so this study may not be representative of current conditions.
Further details regarding the methods used for the comparison may be provided upon request.
A version of this comparison was originally issued with our Newsletter on 8/18/23, to be added to our mailing list contact us, or sign up here.